This demonstration will go over features of Event Console. We're starting at the Dell Management Console portal page. At the bottom there's an event console Web part shows all SMP alerts coming into the console. At the top there's a colored bar indicating critical warning and informational normal errors. And you can also set the refresh rate.
For how often you want to pull in new updates for your alerts. And there's also a check box to turn on full colors on the bar or turn off. You can right clerk on an alert to see the menu of options there. Change severities, create filters, acknowledge, resolve, or pull up details also available from the action menu at the top of the event console Web part. Pulling up details on this critical alert. You can see the description, and the criticality.
There's category protocol definitions. More information here. You can scroll down, get more of the SMP information, such as tap ID, sending host. You can also go to the monitoring and alerting portal page, and the Event Console Web part is also on this portal page. And you can also incidentally bring up the full Event Console by going to the manage menu at the top pulling up Event Console and it will come up in its own window.
Going to the alert rule settings here you can find places where you can set filtering rules such as filtering rules that come in within the same, a few seconds of each other or duplicate alerts. You can also create new filters. And alert definition, host name, product. Count. Date. So you can use all these in your rule. And you use this control here to enable or disable the filtering rule.
Forwarding rules for forwarding SNMP alerts to another console. And this is where you enter the IP address of the console that you'll forward the alerts to. And the community strings. Again, the control to enable or disable that rule. Oftentimes you'll want to run a certain task for SNMP alert that came in. So we can set up a rule based on a lot of different criteria. And then create a new task. And you can choose from any of the tasks here.
So if an alert comes in, then you want to discover device. That's called alert initiated discovery. So you may get an alert from a system that's not been discovered and managed by the console. And we'll bring up the connection profile here, because when you do discovery, you need to specify how you're going to connect to the device. And you can pick the different protocols, SNMP, WMI, so forth. Or another task such as a power control or an e-mail.
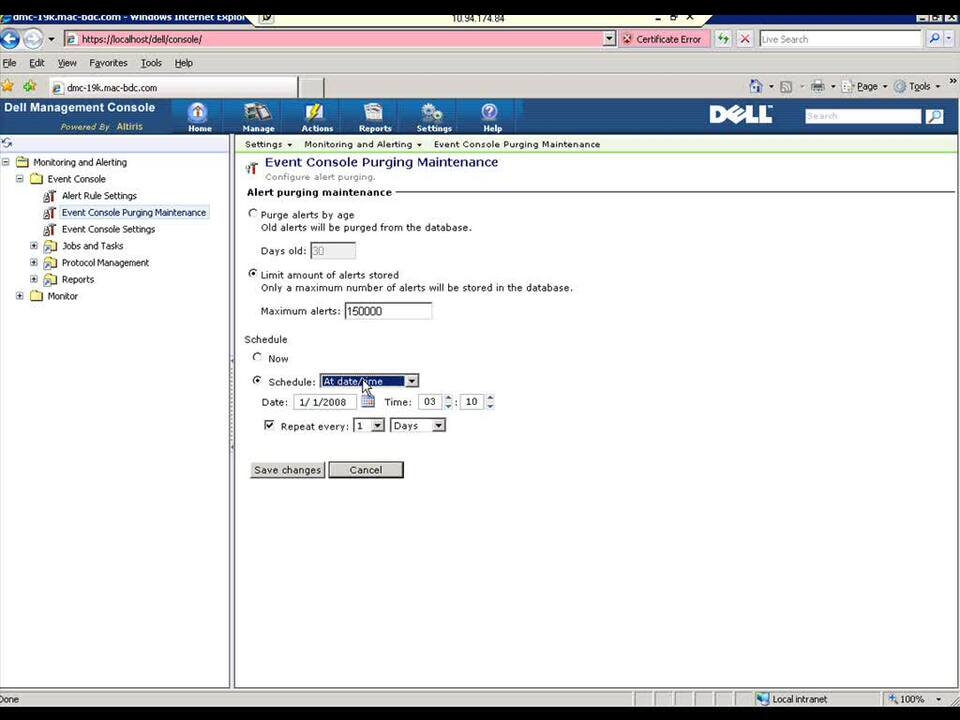
If an alert comes in, then send an e-mail to a predefined address. And controls for editing and deleting the task. There's also options for purging alerts that have been left in the system for a certain amount of time on a scheduled basis, recurring basis. Other event console settings for auto resolving normal alerts. They're generally automatically resolved. And these are these tasks that we demonstrated just a moment ago. And these are where the alert definitions are stored.
And you can go through and review them and edit them here. And there's controls for adding new categories, some alerts or adding alerts. And that would be done from this dialogue. And the standard search and refresh controls. There's some predefined reports for alerts. Such as history, volume by category, and most active hosts. And they have some nice calendar controls there so you can pull in alerts that have occurred between a range of time.
Source and severity are also parameters. And you can click the refresh control and the report will then be updated. Again, like all the reports, you can save out as Web parts, spreadsheets, HTML or XML files. View previous report. And grouping controls as well. Alert volume by category. Most of the alerts there look like from network. Health, redundancy errors. And the legend there at the bottom.
That's configureable, those report parameters, as well. Another similar report. Shows category of the alerts. Environmental, virtual, storage and closures and so forth. And our most active host report, which is a bar chart here and count of alerts at the bottom and hosting along the top access. Again, the Event Console can actually be brought as its own window by going to Manage Event Console.
Similar as Web parts, it's just a full screen view. And as you hover over each of those colors there, you can see the number of alerts in each category, warnings, informational. Some people display the event console on a large screen display so they like to turn on the color bars. If you're seeing that in the distance. But of course resolve and acknowledge options there. Pull up the details on this temperature sensor probe there. And again seeing the details of this SNMP trap.
This was a sensor warning that went off from a server. And change of severities as well. And refresh and you can see the status part, shows the new major alert that we set. And when you go to all devices tree, we can look at all of our discovered devices and when we right click on the device we can bring up the resource manager which is the one-to-one view of that device. And we have a filtered event console Web part which is the filtered view of the alerts, just for that device. That's the Resource Manager. Back to the monitor and alerting portal page.
Thank you very much.

