

1 Rookie
•
31 Posts
0
353
January 5th, 2024 06:07
Aurora R11, system CPU usage always at 10-14% when idle
Hi,
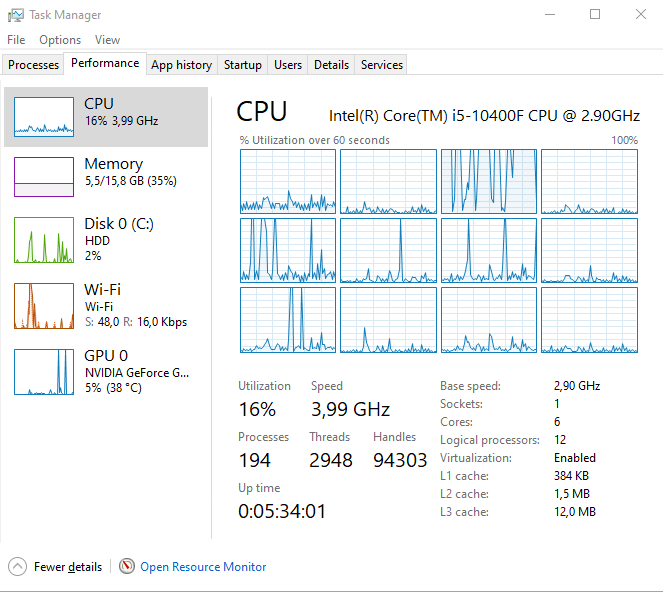
I don't know if this only me but after updating my BIOS to 1.0.22, My CPU usage always at around 10-15% when idle and doing nothing, the temp always at 50 degrees Celsius. It doesn't happen at all before updating the BIOS it suddenly happens after the BIOS update, even edge using lower CPU usage than the system. I don't know what happen, but any help would be appreciated. Warranty expired 7 1/2 months ago.

Thank you.
No Events found!
Odeya
1 Rookie
•
31 Posts
0
January 9th, 2024 02:39
Found fixes by myself, turns out the latest nvidia driver from dell causing the problem, just boot into safe mode clean uninstall every nvidia driver using DDU and then restart, as for now I'm using the driver that comes from windows update rather than from dell website, for now everything works normally, CPU usage is now normal.
Vanadiel
8 Professor
•
7.1K Posts
•
29.7K Points
0
January 5th, 2024 19:59
Right click on the system Icon and select details.
It's part of the Windows processes and a single process, but it should not use that many resources.
Maybe the details will show more information. It should use ntoskrnl as process and file name.
(edited)
Odeya
1 Rookie
•
31 Posts
0
January 6th, 2024 04:25
@Vanadiel Hi, is this the details that you mean?
don't know what ntoskernel doing with that CPU even restart doesn't do anything, I even tried reset bios to default value, even though I never overclock anything besides xmp1, is there any way to track what ntoskernel doing? my CPU always at boost clock speed, the temp always at 50-60 degrees celcius.
Vanadiel
8 Professor
•
7.1K Posts
•
29.7K Points
0
January 6th, 2024 19:45
Yes, that is what I was talking about. Since this is a single process you have to use additional tools to see what it's actually doing.
Use Process explorer process-explorer
You will see system in there also, with the same PID (4). It will show and break down the CPU cycles.
You can then completely break it down by right clicking on System and select Properties, then select the "threads" tab. It will show you in real time what the system process is actually doing. It will also show the CPU cycles in that tab, so you will be able to see what actual process is causing the high CPU cycles from the system process.
Odeya
1 Rookie
•
31 Posts
0
January 7th, 2024 01:04
@Vanadiel This is what been using my CPU:
What is this ExTryQueueWorkItem+0x5a20? It's the only one that using so much CPU load
Vanadiel
8 Professor
•
7.1K Posts
•
29.7K Points
0
January 7th, 2024 04:50
@Odeya That is related to a driver, see here: Exqueue
You can try to kill the process, but it might not allow you to do that pending on what the driver is.
Otherwise you will have to trace the stack further to see if you can link it to the actual driver that is causing the issue.
Odeya
1 Rookie
•
31 Posts
0
January 7th, 2024 11:05
@Vanadiel Tried to kill, suspend, and stack, this is what happen:
Tried to double click the thread giving the same error
Vanadiel
8 Professor
•
7.1K Posts
•
29.7K Points
0
January 9th, 2024 16:42
@Odeya I was going to ask if you recently installed a new driver for your hardware, as that would likely be the issue.
These type of issues can be hard to troubleshoot because it's a kernal issue, but it is for sure related to a driver so what you did to fix it makes sense.