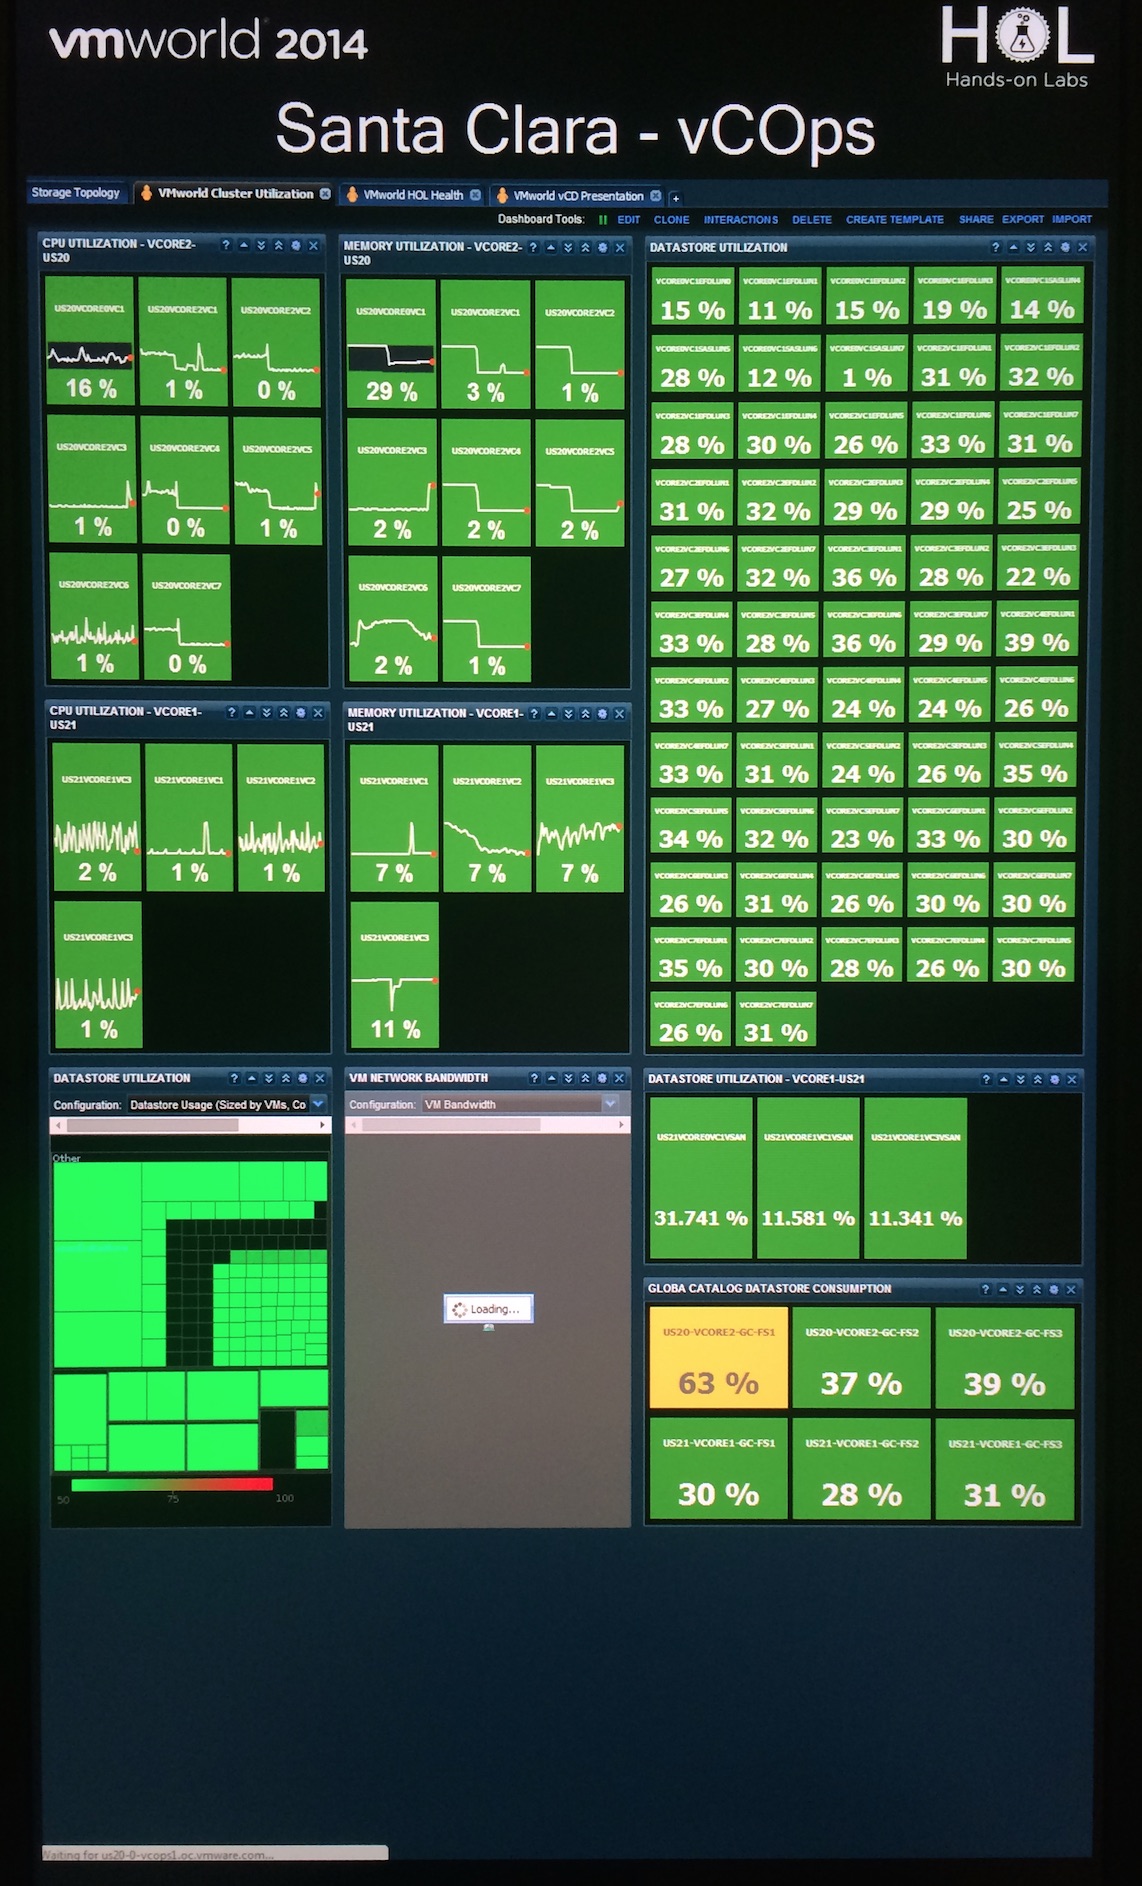
For the last two years, XtremIO has powered the Vmware Hands-On-Labs at Vmworld. One of the very cool things featured in the Hands-On-Labs operations center was the vCOPS (vCenter Operations) dashboard – a graphical display/heat-map that shows at a glance how the data center is running – including your XtremIO all-flash arrays (the lower left corner of the image below).

Well, now through the EMC Storage Analytics package for XtremIO you can create these same custom dashboards in your data center. Our awesome Systems Engineer, Itzik Reich, wrote a blog about this, which gives all the details. You can also watch the demonstration he recorded below.