文章編號: 000126727
How to Collect Netskope Logs
摘要: Logs may be collected for Netskope by following these instructions.
文章內容
症狀
The following article provides details on how to collect logs from Netskope clients.
Affected Products:
- Netskope
Affected Operating Systems:
- Windows
- Mac
- Android
原因
Not applicable
解析度
Click on Windows, Mac, or Android for more information.
Windows
Logs may be collected through the product's:
- User interface (UI)
- Command-line interface (CLI)
- Tenant UI
Click on the appropriate method for more information.
To collect logs:
- Log in to the affected endpoint.
- Right-click the Netskope icon in the System Tray and then click Save Logs.
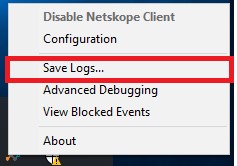
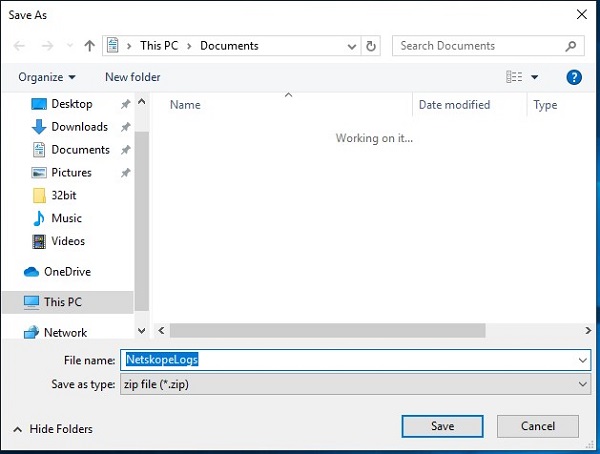
- Choose where to save the log bundle and then click Save.
To collect logs:
- Log in to the affected endpoint.
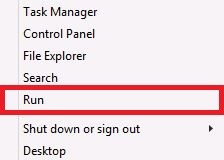
- Right-click the Windows start menu and then select Run.
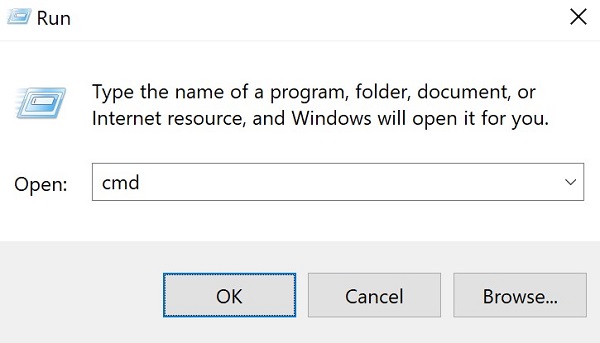
- In the Run UI, type
cmdand then press CTRL+SHIFT+ENTER. This runs Command Prompt as an administrator.
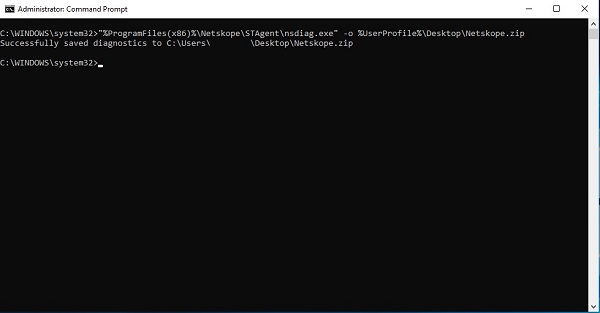
- In Command Prompt, type
"%ProgramFiles(x86)%\Netskope\STAgent\nsdiag.exe" -o "%USERPROFILE%\Desktop\Netskope.zip"and then press Enter.
To collect logs:
To successfully collect logs from the tenant UI, the logs require:
- The affected endpoint to be powered on with a valid user logged in.
- The hostname to be provided to Dell Data Security ProSupport.
- The user email to be provided to Dell Data Security ProSupport.
Warning:
- Only Dell Data Security ProSupport has access to these logs.
- Once log collection is initiated, it may take up to an hour for Dell Support to gain access to the logs. The UI and CLI methods are preferred to the Tenant UI method as to avoid delays.
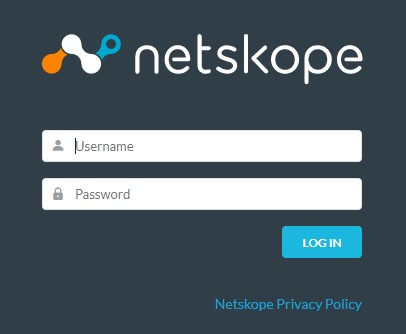
- In a web browser, go to the Netskope web console:
- United States Datacenter: https://[TENANT].goskope.com/
- European Union Datacenter: https://[TENANT].eu.goskope.com/
- Frankfurt Datacenter: https://[TENANT].de.goskope.com/
Note: [TENANT] = The tenant name in your environment
- Log in to the Netskope web console.

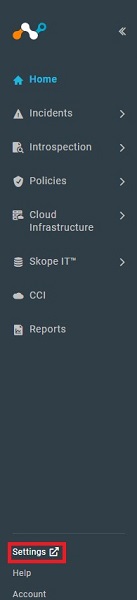
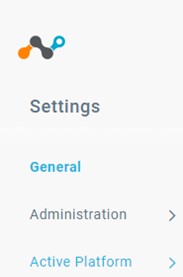
- Click Settings.
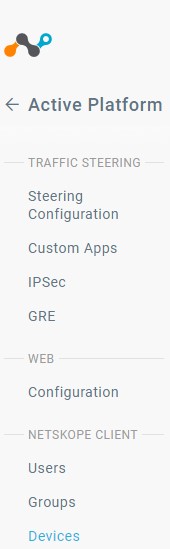
- Click Active Platform.

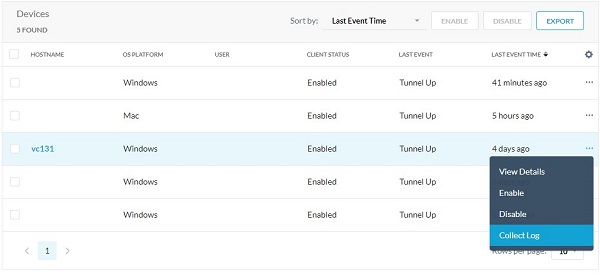
- Click Devices.
- Locate the affected endpoint, select the
...icon to the right, and then click Collect Log.

Note: The device logs are pulled and posted to the Netskope back end within an hour. Only Dell Data Security ProSupport has access to these logs.
Mac
Logs may be collected through the product's:
- User interface (UI)
- Terminal
- Tenant UI
Click on the appropriate method for more information.
To collect logs:
- Log in to the affected endpoint.
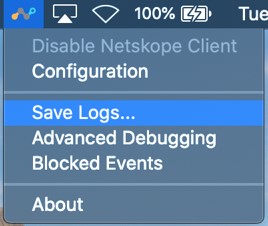
- Click on the Netskope icon in the Menu Bar and then click Save Logs.
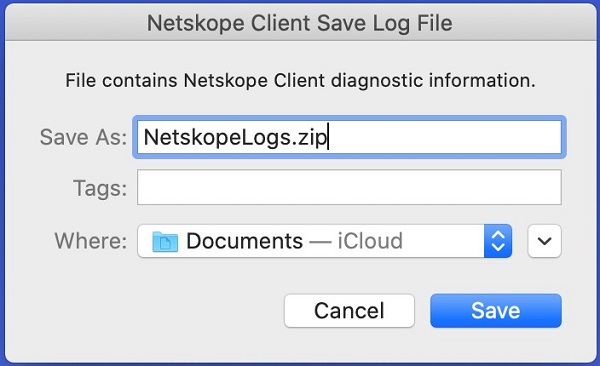
- Choose where to save the log bundle to and then click Save.
To collect logs:
- Log in to the affected endpoint.
- In the Apple menu, click Go and then select Utilities.
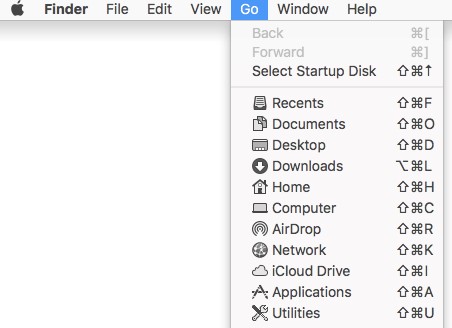
- Double-click Terminal.

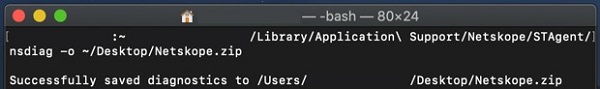
- In Terminal, type
/Library/Application\ Support/Netskope/STAgent/nsdiag -o ~/Desktop/Netskope.zipand then press Enter.
To collect logs:
To successfully collect logs from the tenant UI, the logs require:
- The affected endpoint to be powered on with a valid user logged in.
- The hostname to be provided to Dell Data Security ProSupport.
- The user email to be provided to Dell Data Security ProSupport.
Warning:
- Only Dell Data Security ProSupport has access to these logs.
- Once log collection is initiated, it may take up to an hour for Dell Support to gain access to the logs. The UI and CLI methods are preferred to the Tenant UI method as to avoid delays.
- In a web browser, go to the Netskope web console:
- United States Datacenter: https://[TENANT].goskope.com/
- European Union Datacenter: https://[TENANT].eu.goskope.com/
- Frankfurt Datacenter: https://[TENANT].de.goskope.com/
Note: [TENANT] = The tenant name in your environment
- Log in to the Netskope web console.
- Click Settings.

- Click Active Platform.
- Click Devices.

- Locate the affected endpoint, select the
...icon to the right, and then click Collect Log.
Note: The device logs are pulled and posted to the Netskope back end within an hour. Only Dell Data Security ProSupport has access to these logs.
Android
Logs can be gathered from the App on Android. Click the appropriate method for more information.
To collect logs:
- Open your Netskope Client app from your device’s app launcher.
- In the top-right corner, tap the Menu button and then tap Send Log.
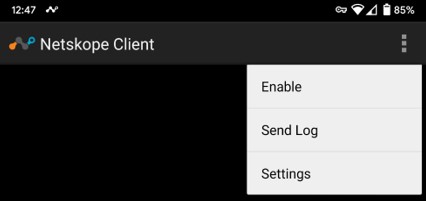
- Your device’s Share Menu displays. Select the way that you would like to send the NetskopeLogs.zip file.
To contact support, reference Dell Data Security International Support Phone Numbers.
Go to TechDirect to generate a technical support request online.
For additional insights and resources, join the Dell Security Community Forum.
其他資訊
影片
文章屬性
受影響的產品
Netskope
上次發佈日期
09 3月 2023
版本
8
文章類型
Solution