PowerEdge: BIOS characterization for HPC with Intel Cascade Lake processors
Summary: BIOS characterization for HPC with Intel Cascade Lake processors
This article applies to
This article does not apply to
This article is not tied to any specific product.
Not all product versions are identified in this article.
Instructions
With the release of the second-generation Intel Xeon® Processor Scalable Family processors (architecture code named "Cascade Lake"), Dell has updated the PowerEdge 14th generation servers to benefit from the increased number of cores and higher memory speeds thus benefiting HPC applications.
This blog presents the first set of results and discusses the impact of the different BIOS tuning options available on PowerEdge C6420 with the latest Intel Xeon® Cascade Lake processors for some HPC benchmarks and applications. A brief description of the Cascade Lake processor, BIOS options, and HPC applications used in this study is provided below.
Cascade Lake is Intel’s successor for Skylake. The Cascade Lake processor supports up to 28 cores, six DDR4 memory channels with speed up to 2933 MT/s. Similar to Skylake, Cascade Lake supports additional vectorization power with the AVX512 instruction set allowing 32 DP FLOP/cycle. Cascade Lake introduces the Vector Neural Network Instructions (VNNI), which accelerates performance of AI and DL workloads like Image classification, speech recognition, language translation, object detection and more. VNNI also supports 8-bit instructions to accelerate inference performance.
Cascade Lake includes hardware mitigations for some side-channel vulnerabilities
. It is expected that this could improve performance on storage workloads, look for future studies from the Innovation Lab
.
Since Skylake and Cascade Lake are socket compatible, the processor tuning knobs exposed in the system BIOS are similar across these processor generations. The following BIOS tuning options were explored in this study, similar to work published in the past on Skylake.
Processor settings:
- Adjacent Cache Line Prefetch: The Adjacent Cache-Line Prefetch mechanism allows automatic hardware prefetch, it operates without programmer intervention. When enabled, it accommodates two 64-byte cache lines into a 128-byte sector, regardless of whether the additional cache line has been requested or not.
- Software Prefetcher: It avoids the stall by loading the data into the cache before it is needed. Example: To prefetch data from main memory to the L2 cache far ahead of the use with an L2 prefetch instruction, and then prefetch data from the L2 cache to the L1 cache before the use with a L1 prefetch instruction In here, when set enabled, the processor will prefetch an extra cache line for every memory request.
- SNC (Sub-Numa Cluster): Enabling SNC is akin to splitting the single socket into two NUMA domains, each with half the physical cores and half the memory of the socket. If this sounds familiar, it is similar in utility to the Cluster-on-Die option that was available in Intel Xeon E5-2600 v3 and v4 processors. SNC is implemented differently from
COD, and these changes improve remote socket access in Cascade Lake when compared to the previous generations, which were using Cluster-on-Die option. At the Operating System level, a dual-socket server with SNC enabled will display fourNUMAdomains. Two of the domains are closer to each other (on the same socket), and the other two will be a larger distance away, across the UPI to the remote socket. This can be seen using OS tools such as:numactl –Hand is illustrated in Figure 1.
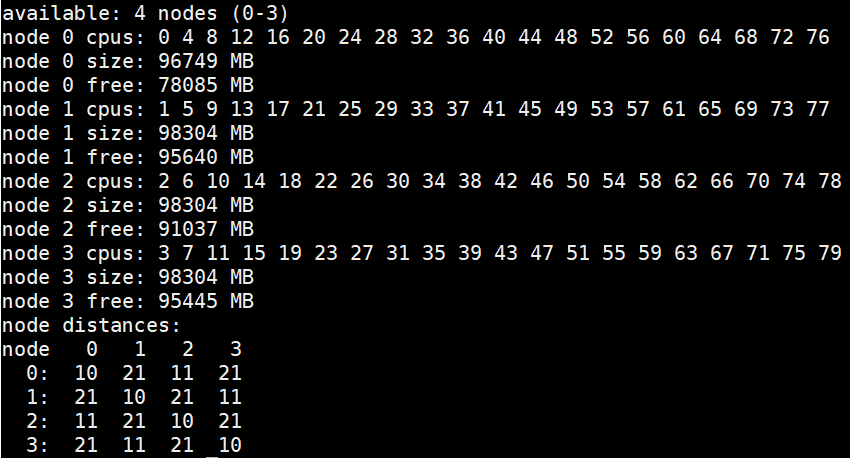
Figure 1: NUMA nodes Layout
System profiles:
The system profiles are a meta option that, in turn, set multiple performance and power management focused BIOS options like Turbo mode, Cstate
, C1E, Pstate management
, Uncore frequency, so on. The different server profiles compared in this study include:
- Performance
- PerformancePerWattDAPC
- PerformancePerWattOS
We used two HPC benchmarks and two HPC applications to understand the impact of these BIOS options on Cascade Lake performance. The configuration of server and HPC applications used for this study is described in Table 1 and Table 2.
Applications |
Domain |
Version |
Benchmark |
|---|---|---|---|
High Performance Linpack(HPL) |
Computation-Solve a dense system of linear equations |
From Intel MKL - 2019 Update 1 |
Problem size 90%, 92% and 94% of total memory |
Stream |
Memory Bandwidth |
5.4 |
Triad |
WRF |
Weather Research and Forecasting |
3.9.1 |
Conus 2.5km |
ANSYS® Fluent® |
Fluid Dynamics |
19.2 |
Ice_2m,Combustor_12m,Aircraft_wing_14m,Exhaust_System_33m |
Table 1: Applications and Benchmarks
Components |
Details |
|---|---|
Server |
PowerEdge server C6420 |
Processor |
Intel® Xeon® Gold 6230 CPU @ 2.1GHz, 20 cores |
Memory |
192GB – 12 x 16GB 2933 MT/s DDR4 |
Operating System |
Red Hat Enterprise Linux 7.6Red Hat Enterprise Linux 7.6 |
Kernel |
3.10.0-957.el7.x86_64 |
Compiler |
Intel Parallel Studio Cluster Edition_2019_Update_1 |
Table 2 Server Configuration
All the results shown here are based on single-server tests; cluster level performance will be bound by the single-server performance. The following metrics were used to compare performance:
- Stream - Triad score as reported by the stream benchmark.
- HPL - GFLOP/second
- Fluent - Solver rating as reported by Fluent
- WRF - Average time step computed over the last 719 intervals for Conus 2.5 km
Benchmarks and Application Results
Graph notation abbreviations:
System Profiles:
Perf - Performance OS - PerformancePerWattOS
  DAPC - PerformancePerWattDAPC
Sub-NUMA Clustering: SNC = 0(SNC = Disabled): SNC = 1(SNC = Enabled: Formatted as Striped in graphs)
SW - Software Prefetcher: SW = 0 (SW = Disabled): SW = 1 (SW = Enabled)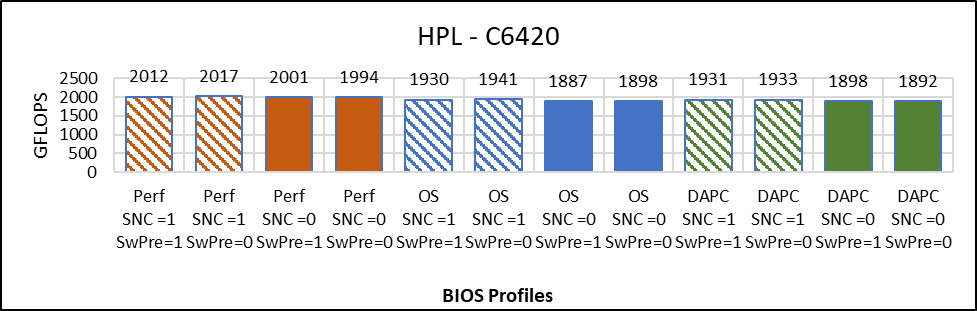
Figure 2: High Performance Linpack
Figure 2 compares the result of HPL with Problem size = 90% that is N=144476 across different BIOS options. The graph plots absolute Gigaflops obtained while running HPL across different BIOS configurations. These Gigaflops obtained are plotted on the y-axis, the higher is the better.
Below are the observations from the graph:
- Less than 1% difference in HPL performance due to software prefetch
- No major effect of SNC on HPL Performance (0.5% better with SNC=Disabled)
- The Performance System Profile is up to 6% better in comparison to OS and DAPC.
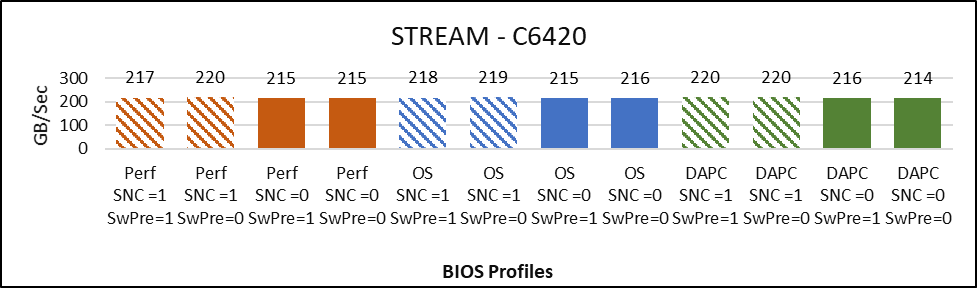
Figure 3: Stream
Figure 3 compares the result of STREAM across the different BIOS configurations.
The graph plots the Memory bandwidth in Gigabytes per second obtained while running STREAM Triad. The Memory bandwidth (GB/Sec) obtained is plotted on the y-axis, the higher is the better. The BIOS configuration associated to specific values of Gigabytes per second are plotted on the x-axis.
Below are the observations from the graph:
- Up to 3% better memory bandwidth with SNC=enabled.
- Not deviation in performance due to Software prefetch on STREAM memory bandwidth
- No deviation across System Profiles
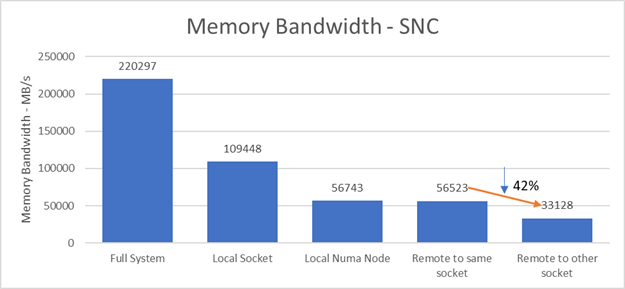
Figure 4: Memory Bandwidth - SNC
Figure 4 plots the Stream Triad memory bandwidth score in such a configuration. The full system memory bandwidth is ~220 GB/s. When 20 cores on a local socket access local memory, the memory bandwidth is ~ 109GB/s - half of the full server bandwidth. Half of this, ~56 GB/s, is the memory bandwidth of 10 threads on the same NUMA node accessing their local memory and on one NUMA node accessing memory belonging to the other NUMA node on the same socket. There is a 42% drop in memory bandwidth to ~33GB/s when the threads access remote memory across the QPI link on the remote socket. This tells us there is a significant bandwidth penalty in SNC mode when data is not local.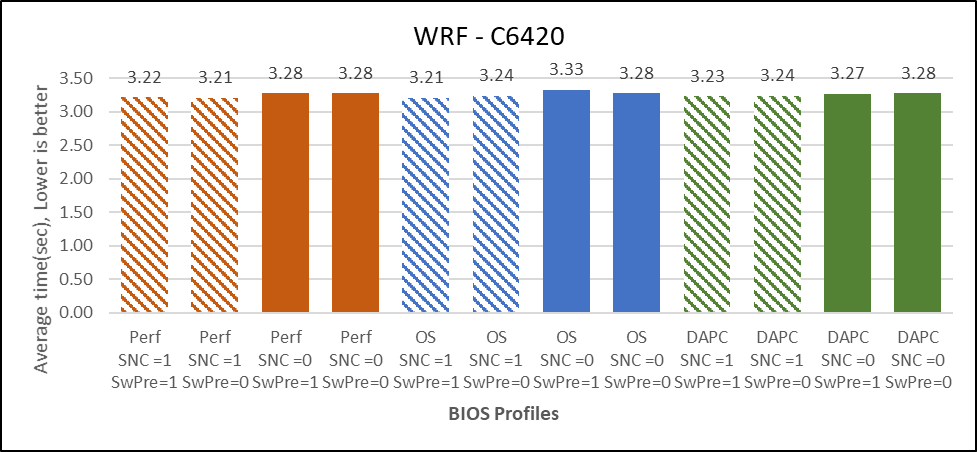
Figure 5: WRF
Figure 5 compares the result of WRF across different BIOS options, the dataset used is conus2.5km with default "namelist.input" file.
The graph plots absolute average timestep in seconds obtained while running the WRF-conus2.5km dataset on different BIOS configurations. The average timestep obtained is plotted on the y-axis, the lower is the better. The relative profiles associated to specific values of average timestep are plotted on the x-axis.
Below are the observations from the graph:
- 2% better performance with SNC=Enabled
- No performance differences for Software Prefetch Enabled vs Disabled.
- Performance profile is 1% better than PerformancePerWattDAPC profiles
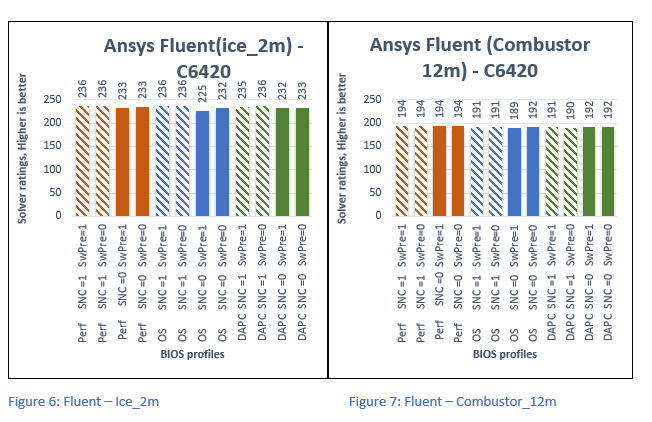
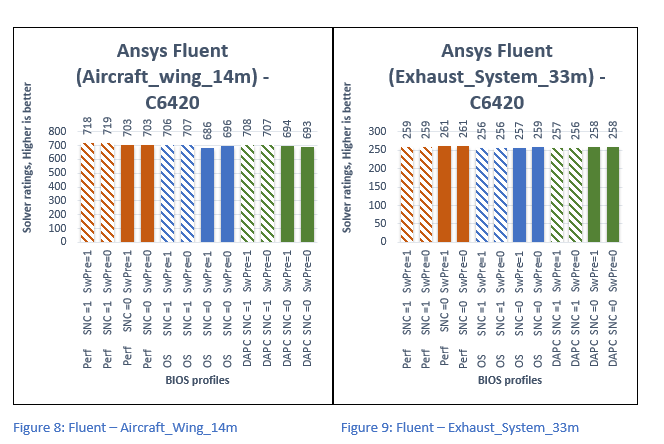
Figure 6 through Figure 9 plots Solver Rating obtained while running Fluent- with Ice_2m, Combustor_12m, Aircraft_Wing_14m, and Exhaust_System_33m dataset respectively. The Solver Rating obtained is plotted on the y-axis, Higher is better. The relative profiles associated to specific values of Average time are plotted on the x-axis.
Below are the overall observations from the above graphs:
- Up to 4% better performance with SNC=Enabled.
- No effects of Software Prefetch on performance.
- Up to 2% better performance with Performance profile compared with DAPC and OS profiles.
Conclusion
In this study, we evaluated the impact of different BIOS tuning options on performance when using the Intel Xeon Gold 6230 processor. Observing the performance of different BIOS options across different benchmarks and applications, the following is concluded:
- Software Prefetch has no significant performance impact on the datasets that were tested. Thus, we recommend Software Prefetcher to stay as default that is Enabled
- With SNC=Enabled 2-4% performance increase in Fluent and Stream, approx. 1% in WRF compared with SNC = Disabled Thus, we recommend that SNC should be enabled to attain better performance.
- Performance profile is 2-4% better than PerformancePerWattDAPC and PerformancePerWattOS. Thus, we recommend the Performance Profile for HPC.
It is recommended that Hyper-Threading be turned off for general-purpose HPC clusters. Depending on the applications used, the benefit of this feature should be tested and enabled as appropriate.
Not discussed in this study is a memory RAS featured called Adaptive Double DRAM Device Correction (ADDDC) that is available when a server is configured with memory that has x4 DRAM organization (32GB, 64GB DIMMs). ADDDC is not available when a server has x8 based DIMMs (8GB, 16GB) and is immaterial in those configurations. For HPC workloads, it is recommended that ADDDC be set to disabled when available as a tunable option.
Affected Products
High Performance Computing Solution Resources, Poweredge C4140, Red Hat Enterprise Linux Version 7Article Properties
Article Number: 000176921
Article Type: How To
Last Modified: 16 Oct 2025
Version: 7
Find answers to your questions from other Dell users
Support Services
Check if your device is covered by Support Services.