Virtualized HPC Performance with VMware vSphere 6.5 on a Dell PowerEdge C6320 Cluster
Summary: HPC, High Performance Computing, HPC and AI Innovation Lab, VMware, vSphere 6.5, Virtualized HPC, Performance, LAMMPS, WRF, OpenFOAM, STAR-CCM+
Symptoms
Article written by Na Zhang, a member of the technical staff working on HPC within VMware’s Office of the CTO.
Resolution
This article presents performance comparisons of several typical MPI applications — LAMMPS, WRF, OpenFOAM, and STAR-CCM+ — running on a traditional, bare-metal HPC cluster versus a virtualized cluster running VMware’s vSphere virtualization platform. The tests were performed on a 32-node, EDR-connected Dell PowerEdge C6320 cluster, located in the Dell EMC HPC Innovation Lab in Austin, Texas. In addition to performance results, virtual cluster architecture and configuration recommendations for optimal performance are described.
Despite the potential benefits of moving HPC workloads to a private, public, or hybrid cloud, performance concerns have been a barrier to adoption. We focus here on the use of on-premises, private clouds for HPC — environments in which appropriate tuning can be applied to deliver maximum application performance. HPC virtualization performance is primarily determined by two factors; hardware virtualization support and virtual infrastructure capability. With advances in both VMware vSphere as well as x86 microprocessor architecture, throughput applications can generally run at close to full speed in the VMware virtualized environment — with less than 5% performance degradation compared to native, and often just 1 – 2% [1]. MPI applications by nature are more challenging, requiring sustained and intensive communication between nodes, making them sensitive to interconnect performance. With our continued performance optimization efforts, we see decreasing overheads running these challenging HPC workloads [2] and this blog post presents some MPI results as examples.

Figure 1: Illustration of several HPC virtualization benefits
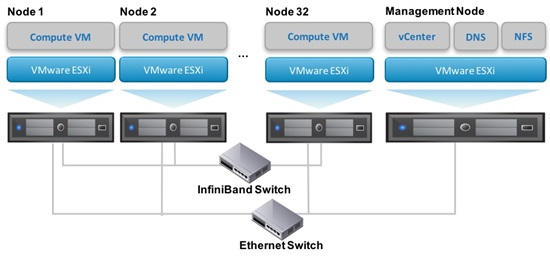
Figure 2: Testbed Virtual Cluster Architecture
Table 1 shows all cluster hardware and software details.
Table 2 shows a summary of BIOS and vSphere settings.
Figures 3-6 show native versus virtual performance ratios with the settings in Table 2 applied. A value of 1.0 means that virtual performance is identical to native. Applications were benchmarked using a strong scaling methodology — problem sizes remained constant as job sizes were scaled. In the Figure legends, ‘nXnpY’ indicates a test run on X nodes using a total of Y MPI ranks. Benchmark problems were selected to achieve reasonable parallel efficiency at the largest scale tested. All MPI processes were consecutively mapped from node 1 to node 32.
As can be seen from the results, the majority of tests show degradations under 5%, though there are increasing overheads as we scale. At the highest scale tested (n32np640), performance degradation varies by applications and benchmark problems, with the largest degradation seen with LAMMPS atomic fluid (25%) and the smallest seen with STAR-CCM+ EmpHydroCyclone_30M (6%). Single-node STAR-CCM+ results are anomalous and currently under study. As we continue our performance optimization work, we expect to report better and more scalable results in the future.
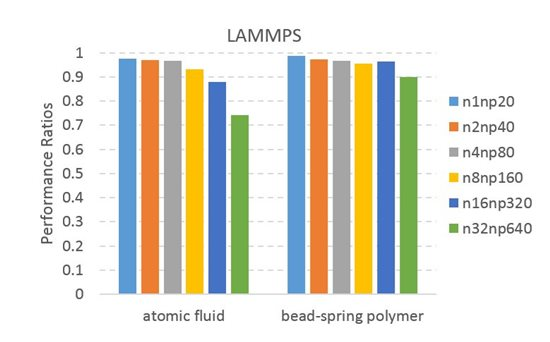
Figure 3: LAMMPS native vs. virtual performance. Higher is better.

Figure 4: WRF native vs. virtual performance. Higher is better.

Figure 5: OpenFOAM native vs. virtual performance. Higher is better.

Figure 6: STAR-CCM+ native vs. virual performance. Higher is better.
If you have any technical questions regarding VMware HPC virtualization, please feel free to contact us!
2. N.Zhang, J.Simons, "Performance of RDMA and HPC Applications in Virtual Machines using FDR InfiniBand on VMware vSphere," VMware Technical White Paper, http://www.vmware.com/files/pdf/techpaper/vmware-fdr-ib-vsphere-hpc.pdf.
3. vCenter Server for vSphere Management, VMware Documentation, http://www.vmware.com/products/vcenter-server.html
4. Bhavesh Davda, "Best Practices for Performance Tuning of Latency-Sensitive Workloads in vSphere VMs," VMware Technical White Paper, http://www.vmware.com/techpapers/2011/best-practices-for-performance-tuning-of-latency-s-10220.html.
Why HPC virtualization
Interest in HPC virtualization and cloud have grown rapidly. While much of the interest stems from gaining the general value of cloud technologies, there are specific benefits of virtualizing HPC and supporting it in a cloud environment, such as centralized operation, cluster resource sharing, research environment reproducibility, multi-tenant data security, fault isolation and resiliency, dynamic load balancing, efficient power management, etc. Figure 1 illustrates several HPC virtualization benefits.Despite the potential benefits of moving HPC workloads to a private, public, or hybrid cloud, performance concerns have been a barrier to adoption. We focus here on the use of on-premises, private clouds for HPC — environments in which appropriate tuning can be applied to deliver maximum application performance. HPC virtualization performance is primarily determined by two factors; hardware virtualization support and virtual infrastructure capability. With advances in both VMware vSphere as well as x86 microprocessor architecture, throughput applications can generally run at close to full speed in the VMware virtualized environment — with less than 5% performance degradation compared to native, and often just 1 – 2% [1]. MPI applications by nature are more challenging, requiring sustained and intensive communication between nodes, making them sensitive to interconnect performance. With our continued performance optimization efforts, we see decreasing overheads running these challenging HPC workloads [2] and this blog post presents some MPI results as examples.
Figure 1: Illustration of several HPC virtualization benefits
Testbed Configuration
As illustrated in Figure 2, the testbed consists of 32 Dell PowerEdge C6320 compute nodes and one management node. vCenter [3], the vSphere management component, as well as NFS and DNS are running in virtual machines (VMs) on the management node. VMware DirectPath I/O technology (i.e., passthrough mode) is used to allow the guest OS (the operating system running within a VM) to directly access the EDR InfiniBand device, which shortens the message delivery path by bypassing the network virtualization layer to deliver best performance. Native tests were run using CentOS on each host, while virtual tests were run with the VMware ESXi hypervisor running on each host along with a single virtual machine running the same CentOS version.
Figure 2: Testbed Virtual Cluster Architecture
Table 1 shows all cluster hardware and software details.
| Hardware | ||
|---|---|---|
| Platform | Dell PowerEdge C6320 | |
| Processor | Dual 10-core Intel Xeon E5-2660 v3 processors@2.6GHz (Haswell) | |
| Memory | 128GB DDR4 | |
| Interconnect | Mellnox ConnectX-4 VPI adapter card; EDR IB (100Gbp/s) | |
| Software | ||
| VMware vSphere | ||
| ESXi Hypervisor | 6.5 | |
| vCenter Management Server | 6.5 | |
| BIOS, Firmware and OS | ||
| BIOS | 1.0.3 | |
| Firmware | 2.23.23.21 | |
| OS Distribution (virtual and native) | CentOS 7.2 | |
| Kernel | 3.10.0-327.el7.x86_64 | |
| OFED and MPI | ||
| OFED | MLNX_OFED_LINUX-3.4-1.0.0.0 | |
| OpenMPI (LAMMPS, WRF and STAR-CCM+) | 1.10.5a1 | |
| Intel MPI (STAR-CCM+) | 5.0.3.048 | |
| Benchmarks | ||
| LAMMPS | v20Jul16 | |
| WRF | v3.8.1 | |
| OpenFOAM | v1612+ | |
| STAR-CCM+ | v11.04.012 | |
Table 2 shows a summary of BIOS and vSphere settings.
| BIOS Settings | ||
|---|---|---|
| Hardware-assisted virtualization | Enabled | |
| Power Profile | Performance Per Watt (OS) | |
| Logical Processor | Enabled | |
| Node Interleaving | Disabled (Default) | |
| vSphere Settings | ||
| ESXi Power Policy | Balanced (default) | |
| Direct Path I/O | Enabled for EDR InfiniBand | |
| VM size | 20 virtual CPUs, 100GB memory | |
| Virtual NUMA Topology (vNUMA) | Auto detected (default) | |
| Memory Reservation | Fully reserved | |
| CPU scheduler affinity | None (default) | |
Results
Figures 3-6 show native versus virtual performance ratios with the settings in Table 2 applied. A value of 1.0 means that virtual performance is identical to native. Applications were benchmarked using a strong scaling methodology — problem sizes remained constant as job sizes were scaled. In the Figure legends, ‘nXnpY’ indicates a test run on X nodes using a total of Y MPI ranks. Benchmark problems were selected to achieve reasonable parallel efficiency at the largest scale tested. All MPI processes were consecutively mapped from node 1 to node 32.
As can be seen from the results, the majority of tests show degradations under 5%, though there are increasing overheads as we scale. At the highest scale tested (n32np640), performance degradation varies by applications and benchmark problems, with the largest degradation seen with LAMMPS atomic fluid (25%) and the smallest seen with STAR-CCM+ EmpHydroCyclone_30M (6%). Single-node STAR-CCM+ results are anomalous and currently under study. As we continue our performance optimization work, we expect to report better and more scalable results in the future.
Figure 3: LAMMPS native vs. virtual performance. Higher is better.
Figure 4: WRF native vs. virtual performance. Higher is better.
Figure 5: OpenFOAM native vs. virtual performance. Higher is better.
Figure 6: STAR-CCM+ native vs. virual performance. Higher is better.
Best Practices
The following configurations are suggested to achieve optimal virtual performance for HPC. For more comprehensive vSphere performance guidance, please see [4].BIOS:
- Enable hardware-assisted virtualization features , e.g. Intel VT.
- Enable logical processors. Though logical processors (hyper-threading) usually does not help HPC performance, enable it but configure the virtual CPUs (vCPUs) of a VM to each use a physical core and leave extra threads/logical cores for ESXi hypervisor helper threads to run.
- It’s recommended to configure BIOS settings to allow ESXi the most flexibility in using power management features. In order to allow ESXi to control power-saving features, set the power policy to the "OS Controlled" profile.
- Leave node interleaving disabled to let the ESXi hypervisor detect NUMA and apply NUMA optimizations
vSphere:
- Configure EDR InfiniBand in DirectPath I/O mode for each VM
- Properly size VMs:
- MPI workloads are CPU-heavy and can make use of all cores, thus requiring a large VM. However, CPU or memory overcommit would greatly impact performance. In our tests, each VM is configured with 20vCPUs, using all physical cores, and 100 GB fully reserved memory, leaving some free memory to consume ESXi hypervisor memory overhead.
- ESXi power management policy:
- There are three ESXi power management policies: "High Performance", "Balanced" (default), "Low Power" and "Custom". Though "High performance" power management would slightly increase performance of latency-sensitive workloads, in situations in which a system’s load is low enough to allow Turbo to operate, it will prevent the system from going into C/C1E states, leading to lower Turbo boost benefits. The "Balanced" power policy will reduce host power consumption while having little or no impact on performance. It’s recommended to use this default.
- Virtual NUMA
- Virtual NUMA (vNUMA) exposes NUMA topology to the guest OS, allowing NUMA-aware OSes and applications to make efficient use of the underlying hardware. This is an out-of-the-box feature in vSphere.
Conclusion and Future Work
Virtualization holds promise for HPC, offering new capabilities and increased flexibility beyond what is available in traditional, unvirtualized environments. These values are only useful, however, if high performance can be maintained. In this short post, we have shown that performance degradations for a range of common MPI applications can be kept under 10%, with our highest scale testing showing larger slowdowns in some cases. With throughput applications running at very close to native speeds, and with the results shown here, it is clear that virtualization can be a viable and useful approach for a variety of HPC use-cases. As we continue to analyze and address remaining sources of performance overhead, the value of the approach will only continue to expand.If you have any technical questions regarding VMware HPC virtualization, please feel free to contact us!
Acknowledgements
These results have been produced in collaboration with our Dell Technology colleagues in the Dell EMC HPC Innovation Lab who have given us access to the compute cluster used to produce these results and to continue our analysis of remaining performance overheads.References
1. J. Simons, E. DeMattia, and C. Chaubal, "Virtualizing HPC and Technical Computing with VMware vSphere," VMware Technical White Paper, http://www.vmware.com/files/pdf/techpaper/vmware-virtualizing-hpc-technical-computing-with-vsphere.pdf.2. N.Zhang, J.Simons, "Performance of RDMA and HPC Applications in Virtual Machines using FDR InfiniBand on VMware vSphere," VMware Technical White Paper, http://www.vmware.com/files/pdf/techpaper/vmware-fdr-ib-vsphere-hpc.pdf.
3. vCenter Server for vSphere Management, VMware Documentation, http://www.vmware.com/products/vcenter-server.html
4. Bhavesh Davda, "Best Practices for Performance Tuning of Latency-Sensitive Workloads in vSphere VMs," VMware Technical White Paper, http://www.vmware.com/techpapers/2011/best-practices-for-performance-tuning-of-latency-s-10220.html.
Article Properties
Article Number: 000146897
Article Type: Solution
Last Modified: 10 Apr 2021
Version: 3
Find answers to your questions from other Dell users
Support Services
Check if your device is covered by Support Services.
Article Properties
Article Number: 000146897
Article Type: Solution
Last Modified: 10 Apr 2021
Version: 3
Find answers to your questions from other Dell users
Support Services
Check if your device is covered by Support Services.