The “sweet spot” is an American sports term used to describe the zone on the baseball bat or tennis racket that generates the most power. When the ball strikes the sweet spot, the athlete gets the best results. Best results are what all HPC customers want out of their clusters.
Why? Best results drive faster answers to the world’s most pressing problems, such as:
- Safer and more energy efficient automobiles
- Medical breakthroughs in health care diagnosis and treatments
- Smarter business decisions
HPC customers continue to tell Dell, “Get me a server that allows me to do more work in the most efficient amount of space at fair price, so I can get the highest performance out of my code to produce the fastest and best results.” The best results for HPC customers are driven by more processing cores, more memory, and fast interconnects.
In the past, customers were intrigued by what 4-socket platforms had to offer as far as performance, but the sweet spot was 2-socket servers due to server density and performance per watt. The 4-socket servers were typically 4U of rack space with a higher price tag, resulting in less performance per dollar. 
This has all changed with the Dell™ PowerEdge™ C6145 powered by AMD Opteron™ 6200 Series processors. The AMD Opteron 6200 series processors deliver the world’s first x86 16-core processor, delivering a rich mix of performance, scalability and efficiency for today’s highly threaded computing environments. AMD’s new 16-core architecture is engineered for next generation HPC computing, featuring an innovative design that drives more core density and greater throughput with 60-160% more cores than the competition. More cores equal better performance and scale.
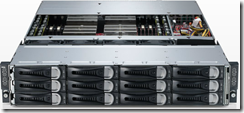
The PowerEdge C6145 delivers the industry’s only two 4-socket servers, 128 cores, up to 1TB of memory, and massive I/O all in an efficient 2U shared infrastructure server with the highest performance. All the cores, memory, I/O, and server density work together to make HPC clusters faster and more powerful, like a baseball soaring off the sweet spot of a bat.
When the PowerEdge C6145 performance and density is compared to other published 4-socket SPEC benchmark scores, it is immediately apparent why this server will become the new sweet spot for HPC customers.
- The Dell PowerEdge C6145 can deliver up to 281% more performance per U compared the HP Proliant DL980 G7, in a quarter of the rack space.*
- The Dell PowerEdge C6145 can outperform the HP Proliant DL580 G7 by up to 423% in performance per U, in 50% less space.**
- The Dell PowerEdge C6145 can provide up to 200% more performance per dollar compared to the IBM x3850 X5, in half the space.***
Visit Dell.com to find HPC computing’s new sweet spot — the award-winning PowerEdge C6145!
* Based on the SPECint_rate2006 benchmark test performed by Dell SPA Labs in November, 2011. Dell PowerEdge C6145: SPECint_rate2006 of 2080 in 2U as compared to HP ProLiant DL980 G7: SPECint_rate2006 of 2180 in 8U. Actual performance will vary based on configuration, usage and manufacturing variability. SPEC® and the benchmark name SPECint® are registered trademarks of the Standard Performance Evaluation Corporation. Competitive benchmarks stated above reflect results published or submitted to www.spec.org as of November 1, 2011. The comparison presented above is based on the best performing 8-chip x86 servers. For the latest SPECint_rate2006 benchmark results, visit http://www.spec.org/cpu2006.
**Based on the SPECint_rate2006 benchmark test performed by Dell SPA Labs in November, 2011. Dell PowerEdge C6145: SPECint_rate2006 of 2080 in 2U as compared to HP ProLiant DL580 G7: SPECint_rate2006 of 795 in 4U. Actual performance will vary based on configuration, usage and manufacturing variability. SPEC® and the benchmark name SPECint® are registered trademarks of the Standard Performance Evaluation Corporation. Competitive benchmarks stated above reflect results published or submitted to www.spec.org as of November 1, 2011. The comparison presented above is based on the best performing 8-chip x86 servers. For the latest SPECint_rate2006 benchmark results, visit http://www.spec.org/cpu2006.
*** Based on the SPECint_rate2006 benchmark test performed by Dell SPA Labs in November, 2011. Dell PowerEdge C6145: SPECint_rate2006 of 2080 in 2U as compared to IBM x3850 X5: SPECint_rate2006 of 1070 in 4U. Actual performance will vary based on configuration, usage and manufacturing variability. SPEC® and the benchmark name SPECint® are registered trademarks of the Standard Performance Evaluation Corporation. Competitive benchmarks stated above reflect results published or submitted to www.spec.org as of Nov. 1, 2011. The comparison presented above is based on the best performing 8-chip x86 servers. For the latest SPECint_rate2006 benchmark results, visit http://www.spec.org/cpu2006. All prices based on retail pricing as of November 1, 2011.